The question no dashboard answers today
Every CTO we work with is being asked questions like these, usually by the CEO, the CFO, the board, or an enterprise customer in a security review:
How many engineers on our team actually use AI, and how often?
What are they using it for, and where is it producing real value?
Why are some of our engineers shipping noticeably faster with AI than others? Is it the tool stack they use, the workflow they follow, or something else?
Where do we need to invest in training, and which use cases are we leaving on the table?
Which models, tools, and skills are working, and which ones are we paying for that nobody touches?
What is the all-in cost per engineer, per team, per use case, per token, and where can a cheaper model do the same job?
If we change provider or downgrade a model, what breaks, and what does the bill look like?
Who is using AI outside the sanctioned tools, and with what data?
No single tool answers any of this, because every engineer now uses several AI tools at once: GitHub Copilot for code review, Cursor or Claude Code inside the IDE for writing, ChatGPT or Claude in a browser for problem discussion and architecture, plus a few internal skills on top. The IDE vendor reports usage of its own product, the model provider reports token counts, the chat tool reports transcripts, finance reports an invoice, security reports a list of blocked domains. None of them reports the combined picture: one engineer's full AI workflow across every tool they touch, and whether that stack is making them faster or just busier.
The cost of not having a defensible answer is concrete: AI budgets grow faster than engineering productivity, training investment lands on the wrong skills, vendor lock-in happens by accident, and audit conversations that should take three days take three weeks. Most leaders can absorb any one of those quietly; all four landing together at a board meeting is the harder problem.
We kept hitting this gap in our consulting work, so we started building our own answer. Atlas is our internal AI engineering intelligence platform, currently in active beta. We use it on our own engineering work and with a small set of design-partner teams to give technical leaders a single, defensible view of AI adoption, effectiveness, cost, and risk across their engineering organisation.
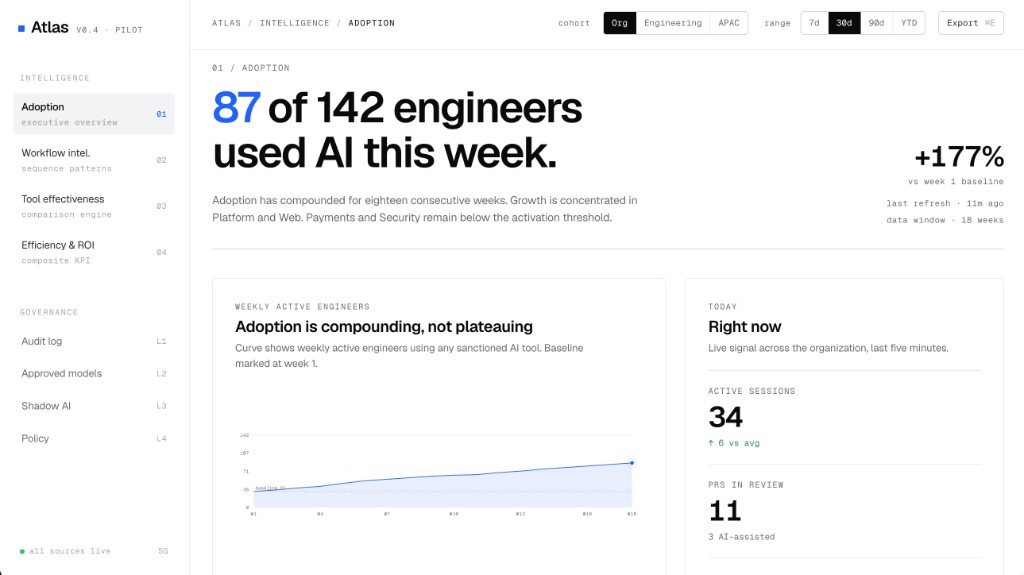 Atlas executive overview: the headline adoption number, +177% vs week 1 baseline, the weekly active engineers curve, and the live "Right now" panel with active sessions and AI-assisted PRs. The left rail shows the four intelligence views (Adoption, Workflow intel, Tool effectiveness, Efficiency & ROI) and the governance views (Audit log, Approved models, Shadow AI, Policy)
The rest of this article walks through what Atlas measures, why each measurement matters for a CTO or a CEO, and how we use it ourselves. The screenshots are the actual panels Atlas renders, captured straight from the tool.
What Atlas is, and what it is not
Atlas is a read-only intelligence layer that sits on top of the tools your engineering team already uses: code hosts, CI, IDE telemetry, AI vendor APIs, billing exports, and SSO logs. It does not replace your IDE, your AI provider, or your compliance platform. It correlates their data so you can answer questions that none of them can answer alone.
We kept the scope narrow on purpose:
Atlas surfaces what is happening. Blocking, policy, and access control stay in your IdP, your code host, and your security stack.
It is tuned for software engineering signal: PRs, diffs, build outcomes, prompts in coding tools. We stitch together usage across every AI tool your engineers touch: IDE assistants, chat tools, code review bots, CLI agents, internal skills. The picture you get is one engineer's full AI workflow rather than one vendor's slice of it. General enterprise AI observability is somebody else's product.
Every metric has to survive a CFO or an auditor. "Tokens used last month" rarely does. "Tokens per merged PR, by team, with the cost attached" usually does.
The product is structured around four intelligence views in the sidebar (Adoption, Workflow intel, Tool effectiveness, Efficiency & ROI), plus an emulation capability that spans them, and a smaller set of governance views. The next six sections walk through each one.
1. Adoption: who is using AI, beyond the seat count
Adoption sounds like an easy question to answer, but in practice it is slippery. Most organisations only know the answer one of two ways: a self-reported survey ("about 70% of engineers use AI") or a seat count from the vendor ("we have 200 Copilot seats"). Neither tells you who pressed accept on AI-generated code last week.
Atlas builds the adoption signal from activity rather than entitlement. For each engineer, in each week, we look at three things: did they open an AI-assisted session, did any of their merged work carry an AI signature, and did they cross a minimum activity threshold rather than just opening the IDE once.
The headline number is the easy part, and the overview image above leads with it. The interesting view is one level down, where adoption gets attributed to specific teams and leads:
Weekly active engineers as a curve, with a baseline marker. A flat or declining curve after the first ninety days is a louder signal than any survey.
Adoption per team, with the lead named. Two squads usually carry the average, and two squads usually drag it. Both are interesting; neither is visible from a seat report.
Live signal, so leaders can see active sessions, AI-assisted PRs in review, and the dominant tool right now, not last month.
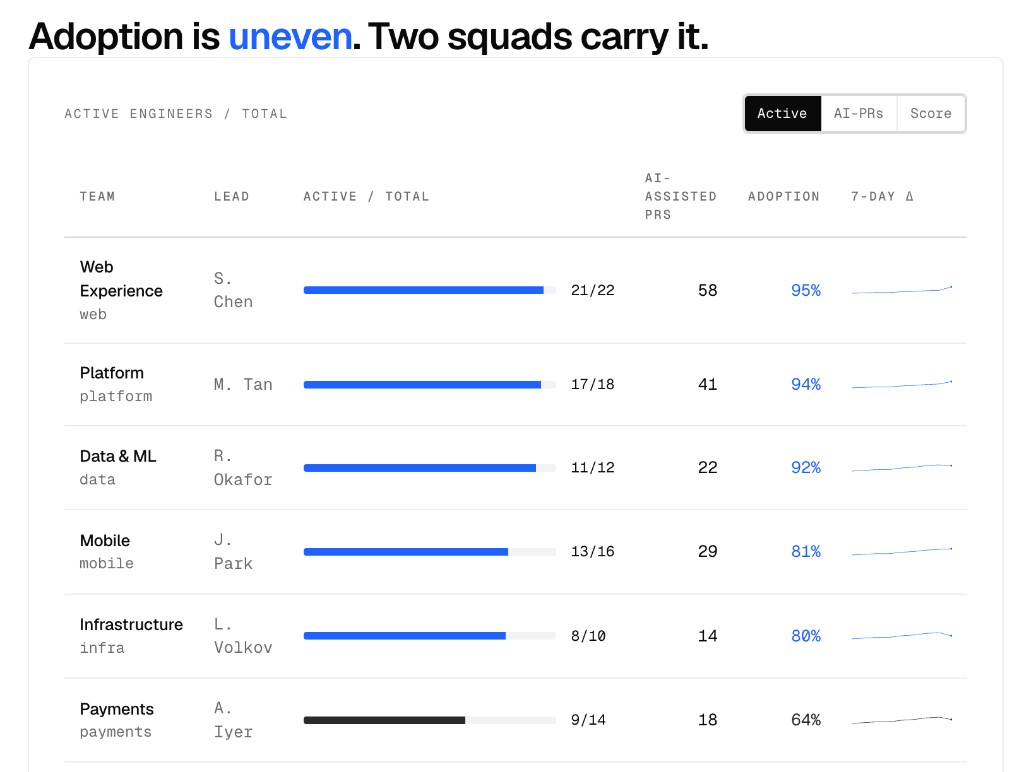 Atlas team-adoption table: per squad active engineers over total (with blue bars above the activation threshold and black bars below), AI-assisted PR count, adoption percentage, and the seven-day trend sparkline. Web Experience and Platform pull the average up; Payments and Security sit below the threshold
The teams below an activation threshold are the most useful output of this view. Some of them have workloads that genuinely benefit less from AI, and that is fine. Even so, they are where the leadership conversation has to start. The options are usually to change the rollout, change the training, or accept that AI is not the right lever for them right now.
2. Usage: what AI is being used for
Knowing who is logging in is one thing. The question that drives training, tooling, and policy investment is what they are doing once they get there.
We classify each AI-assisted interaction into a small set of engineering use cases: code generation, debugging, refactoring, test generation, architecture discussion, SQL and data work, documentation, and incident triage. The classification is inferred from the prompt, the surrounding code, and the diff that follows, not from a self-report. We then overlay that mix on the merge pipeline (discovery, code, tests, review, docs) so leaders can see where AI is and is not touching the work.
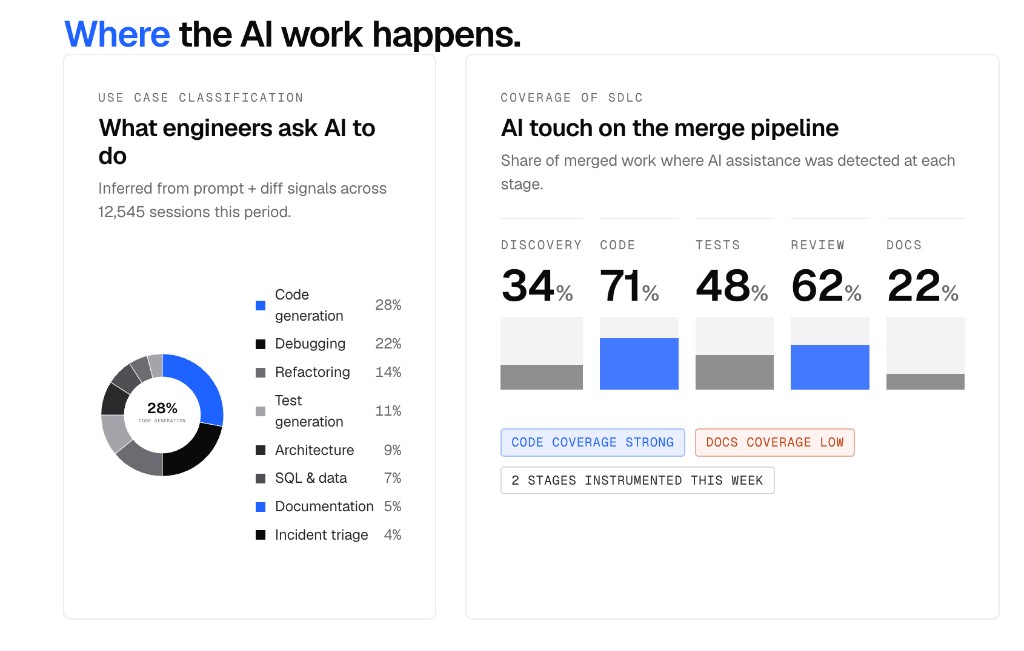 Atlas "Where the AI work happens" panel: the donut chart on the left is the use case mix (28% code generation, 22% debugging, 14% refactoring, 11% test generation, 9% architecture, 7% SQL & data, 5% documentation, 4% incident triage). The bars on the right are AI touch across the merge pipeline (Discovery 34%, Code 71%, Tests 48%, Review 62%, Docs 22%) with the "code coverage strong / docs coverage low" flags
Two patterns matter here:
The mix tells you what to invest in. If 28% of sessions are code generation but only 5% are documentation, your AI-assisted documentation workflow is either missing or so bad that nobody uses it. That points at a specific training and tooling gap you can close.
Use case coverage across the SDLC. The bars on the right of the panel above show exactly that. When AI touches 71% of code work but only 22% of docs and 34% of discovery, the bottleneck sits everywhere except the coding step. The mix usually surprises leaders, in both directions.
This is where Atlas starts to disagree with the marketing material. AI is not equally useful for every use case in every codebase. Atlas makes the unevenness explicit, so you can stop debating it and start deciding what to do about it.
3. Workflow intel: which sequences pay off, which leak time
Adoption and usage cover who is doing what. The next layer down is how engineers string those steps together, because the sequence is what determines whether AI is producing real velocity gains.
Atlas mines the AI-assisted sessions for recurring step sequences and scores them against merge rate, cost index, and velocity index relative to a baseline engineer. These are real chains of actions your engineers run today, surfaced from session data rather than a workshop whiteboard.
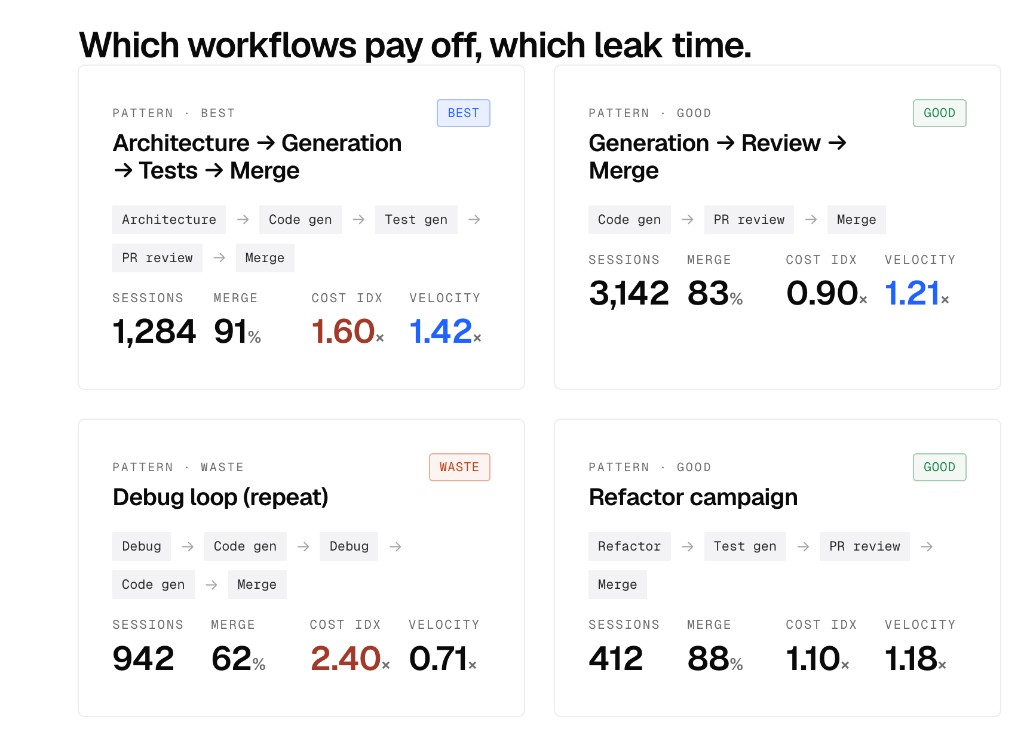 Atlas workflow intel panel: four patterns scored side by side. "Architecture → Generation → Tests → Merge" is flagged BEST with 1,284 sessions, 91% merge, 1.60x cost index, 1.42x velocity. "Generation → Review → Merge" is GOOD (3,142 sessions, 83% merge, 0.90x cost, 1.21x velocity). "Debug loop (repeat)" is flagged WASTE (942 sessions, 62% merge, 2.40x cost, 0.71x velocity). "Refactor campaign" is GOOD (412 sessions, 88% merge, 1.10x cost, 1.18x velocity)
The pattern that almost always shows up first is the debug loop: ask AI, run code, fail, ask AI again, run code, fail, ask AI again. It looks like productive work in the IDE but burns 2.4x the average cost per session at a 62% merge rate and 0.71x the velocity of a baseline engineer. Teams are usually shocked when they see how much of their AI bill goes to loops like this.
The opposite pattern is the architecture-first chain, where engineers reason out the design with AI before generating, then test, review, and merge. It costs 1.6x per session but delivers 1.42x velocity at 91% merge rate. The unit cost goes up; the unit cost per merged change goes down. That is the trade leaders want.
This view exists so team leads can see the patterns clearly enough to coach around them in code review and pair sessions, which is where workflow habits shift.
4. Tool effectiveness: which models, tools, and stacks earn their place
Workflow patterns expose how AI is being used. The harder question is whether the tools and models you are paying for are pulling their weight in those patterns. Most organisations cannot answer it, because the data lives in different systems and the comparison is never apples-to-apples. Copilot reports on Copilot, Claude reports on Claude, and ChatGPT reports nothing useful to engineering leadership. Each tool benchmarks itself against itself, never against the others, and never against the engineer who is using all of them at once.
Atlas unifies the view. Copilot suggestions accepted in review, Cursor or Claude Code edits inside the IDE, ChatGPT or Claude conversations linked to the work that followed, CLI agent runs, internal skill invocations: all of them get correlated to the same merge events. That puts the comparison on a single axis: how much merged work each tool produced, at what cost, with what downstream defect rate.
On top of that unified data, Atlas builds a comparison engine across the dimensions that matter to engineering leadership:
Model effectiveness per use case. For each use case, we track acceptance rate, edit distance after acceptance, time-to-merge, and downstream defect rate for the work that touched a given model. A model that wins on code generation often loses on refactoring, and vice versa. The default "use the newest one" answer is rarely correct.
Tool effectiveness per workflow. The same model, embedded in different tools, performs differently. An inline assistant, a chat panel, a code-review bot, and an agentic CLI are not interchangeable. Atlas separates them so you can see which surface area is doing the work, and which is just adding noise.
Skill effectiveness. Custom skills, prompt templates, agents, and rules that teams write themselves get versioned and tracked. We can see which ones are heavily used and still winning, which ones are heavily used but quietly producing worse outcomes, and which ones nobody invokes anymore. The last category is where most internal AI investment goes to die.
Stack effectiveness across the team. The top quartile of engineers by velocity tends to use a specific combination of tools and habits. For example: ChatGPT or Claude in a browser to frame the problem, Claude Code or Cursor inside the IDE to write it, Copilot review on the PR, and one or two internal skills layered on top. The bottom quartile tends to use a different stack, or the same tools in a different order. Atlas surfaces those patterns at the aggregate level only (never as a personal scorecard) so leaders can see whether a productivity gap is talent, training, habit, or tool mix. Whenever we have looked at this, on our own engineering work and on data from design-partner teams, the gap has been at least partly tool mix, and tool mix is fixable in weeks rather than years.
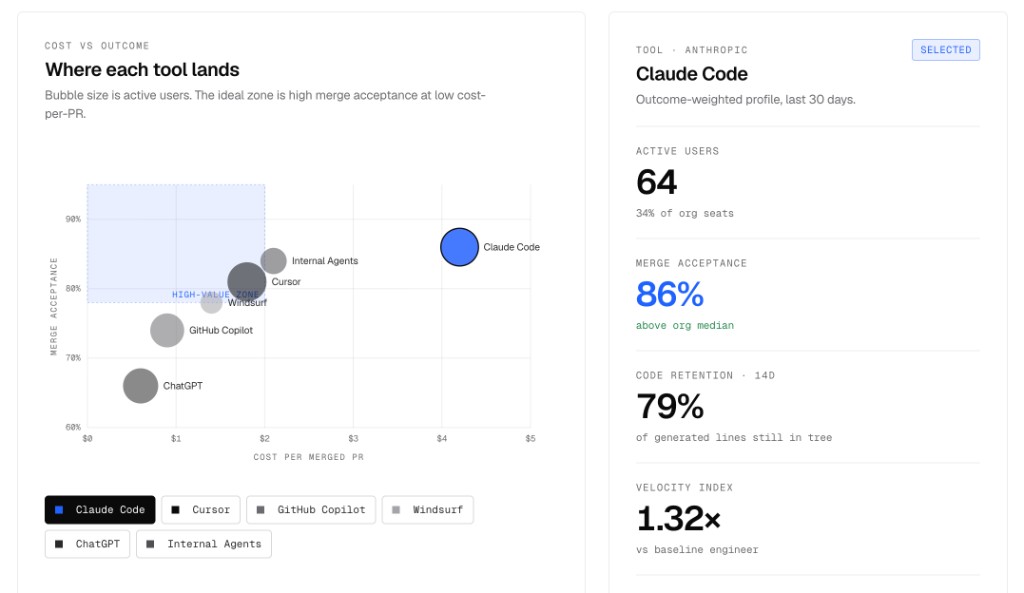 Atlas tool effectiveness panel: "Where each tool lands" plots merge acceptance against cost per merged PR for Claude Code, Cursor, Windsurf, GitHub Copilot, ChatGPT, and internal agents, with bubble size as active users and a "high-value zone" highlighted. The selected tool drawer on the right profiles Claude Code: 64 active users (34% of org seats), 86% merge acceptance (above org median), 79% code retention at 14 days, and a 1.32x velocity index versus a baseline engineer
The shape of the answer is usually: two or three tools earn their keep across the portfolio, one or two are essentially dead weight, a handful of internal skills carry most of the value, and the long tail of "clever prompts somebody wrote in Q1" is no longer doing anything. None of this is visible from any single vendor dashboard, because vendors do not benchmark themselves against each other on your data, and nobody but you can see the whole stack at once.
5. Efficiency and ROI: cost per model, per token, per feature
Sooner or later, every leadership conversation about AI lands on money. A token bill on its own rarely survives a CFO meeting. What they want is the unit economics behind it.
Atlas resolves cost down to units engineering leaders can reason about:
Cost per model. Total spend, broken down by provider and model, with the token mix attached (input, output, cached, tool calls). This is the floor.
Cost per token, normalised across providers. Vendors price differently. We restate them on a common basis so you can compare a high-context model with a cheap one without doing the maths by hand.
Cost per feature. For each shipped feature or epic, we attribute the AI cost incurred during its development: prompts, agent runs, evaluations, retries. This is where AI ROI becomes a real conversation. If a feature cost £40,000 of engineering time and £180 of AI spend and shipped a month earlier, the answer is obvious. If a feature cost £40,000 of engineering time and £8,000 of AI spend and still slipped, the answer is also obvious, but in the other direction.
Cost per AI-assisted PR. A simpler unit when feature attribution is hard. The number is stable once an organisation has been at it for a few months, which makes it a useful KPI to track over time.
Two things tend to surprise leaders here. The first is that most spend is concentrated in a small number of users, models, and use cases. The long tail is cheaper than the headline suggests. The second is that a meaningful share of spend goes to retries, evaluations, and failed agent runs, not to user-facing work. On the data we have looked at so far, including our own usage and a small set of design-partner teams, this share has sat between 10% and 25%. Atlas surfaces both, which is uncomfortable in the short term and useful at the next budget cycle.
6. Emulation: simulate the next model or vendor switch
Model and vendor change is the new normal: a provider deprecates a model on a Friday, a new model launches and your team wants to migrate, or procurement asks what happens if you move 30% of usage to a cheaper provider. Today, most teams answer those questions with a back-of-the-envelope estimate and a prayer.
Atlas includes an emulation layer that lets us run those questions as scenarios on the last 90 days of real usage:
Model swap. "If we route all refactoring traffic to Model B instead of Model A, what does the bill look like, what does latency look like, and where do we expect acceptance rate to drop based on the historical mix?"
Vendor swap. "If we move from Vendor X to Vendor Y for everything except agentic workflows, what is the projected monthly cost, what context windows do we lose, and which skills become unusable?"
Tier change. "If we drop from the premium tier to the standard tier on 60% of seats, which users feel it and on which use cases?"
Outage modelling. "If our primary provider is down for four hours, what fraction of engineering work is blocked, and what is the cheapest fallback that keeps the merge queue moving?"
These are structured estimates rather than perfect forecasts: your own historical data, restated against new prices and new model behaviours. In practice they are accurate enough to turn the procurement conversation into a quantitative one, which is usually the bigger win.
From measurement to action: the decisions Atlas helps you make
The dashboards are the means; what we deliver is a short list of decisions you can defend. Across the cases we have run so far, Atlas tends to surface the same five categories of action.
Target the training and skill gaps that matter. The usage mix and the tool effectiveness panel show exactly where your team is leaving value on the table. If documentation and testing sit below 10% of sessions while code generation sits at 28%, the bottleneck is engineering habit, and it is fixable with enablement, paired examples, and a few well-placed internal skills. We translate the gap into a specific training plan, ship it, and measure the move in the same dashboard the following month.
Adopt what is needed to close the gaps. Atlas's cross-vendor view tells us which tool, model, or internal skill from your existing portfolio (or one you have not yet trialled) maps to the use case where your team is underperforming. Most of the time the fix is adoption-shaped: you already own the right tool, and Atlas tells you which engineers would benefit most and which capability would tip them over.
Stop paying for tools and seats that do not earn their place. The Tool effectiveness view already names the underperformers, with cost-per-merged-PR and affected user count attached. We help you renegotiate, downgrade the tier, or remove the tool entirely, and Atlas tracks whether productivity moves in response. It rarely does, which makes the next procurement conversation a short one.
Use the cheaper model where it works. Not every prompt needs a frontier model. Atlas already knows which use cases are price-sensitive (debug loops, simple refactors, boilerplate, documentation) and which are not (architecture, complex generation, agentic workflows). We model the swap with the emulation layer first, then route the right traffic to a cheaper model and watch the merge rate. The typical outcome is a 15–35% reduction in spend on the rerouted traffic, with no measurable drop in output quality.
Coach the expensive workflow patterns out. The debug-loop pattern is the single most costly workflow most teams have, and it is invisible until Atlas names it. The fix here is coaching, not new procurement. We work with team leads to surface it in code review and pair sessions, and we track the share of sessions in that pattern week over week. The savings compound from week one.
None of these decisions are exotic. They live on every CTO's mental list already. Atlas's contribution is to attach the data that makes each call defensible to a CFO or a board, and to measure whether the call worked once it has been made.
Governance: audit log, approved models, shadow AI, policy
Atlas's governance views are deliberately small. Enforcement lives in your existing security stack; what Atlas adds is the underlying intelligence that makes governance real:
Audit log. Every AI-assisted interaction we can see is logged with user, tool, model, prompt fingerprint, diff fingerprint, and outcome. This is what auditors and enterprise customers ask for when they ask, "can you show us what AI did in your codebase last quarter?"
Approved models. A canonical list of models that are sanctioned for which use cases, with version, region, and data handling notes. The list becomes the policy artefact, and any usage outside it shows up as a flagged event in the audit log.
Shadow AI. Activity that does not match any sanctioned tool gets surfaced: personal accounts, browser-based assistants, IDE plugins that nobody approved. It is the first surprise in almost every case we have looked at, and it is consistently larger than leadership expects.
Policy. Plain-language statements of what is allowed, what is not, and what requires review, tied directly to the metrics that prove the policy is being followed.
None of this is about catching engineers out. The aim is to make the gap between policy and reality visible enough that you can close it before an incident makes it everyone's problem.
What Atlas is intentionally not
A few things Atlas does not try to do, because they are someone else's job:
It is not an IDE or an agent. We do not generate code, run prompts, or replace anything in the developer workflow. We read the trace of what other tools did.
It is not a productivity scorecard. The unit of analysis is team, use case, model, and skill, never the individual engineer. The moment a tool like this becomes a personal scorecard, the data quality collapses, because people work around it.
It is not a compliance product. We feed compliance, but the controls live in your IdP, your code host, and your security stack. Atlas's job is to make the gaps visible; closing them happens elsewhere.
It is not a marketplace. We have strong opinions about models and tools, but Atlas itself is provider-neutral by design. Our goal is to make your tooling decisions defensible. We have no licences to sell.
Where Atlas is today, and how we work with design partners
Atlas is in active internal beta. We use it on our own engineering work and with a small group of design-partner teams who let us run it against their data while we sharpen the metrics, integrations, and framing in this article. It is not a SaaS product, and we are not selling seats. The intent is for Atlas to sit behind the work we already do with engineering leaders: short diagnostic conversations, focused rollout or remediation programmes, and longer-term operating-model engagements where the same metrics become the monthly review signal. The underlying playbook is in the AI adoption checklist; Atlas is how we plan to know that the checklist is working.
We are currently looking for a small number of additional design partners. The shape of the arrangement is simple: we connect Atlas to a representative slice of your tooling (code host, CI, one or two AI vendor APIs, billing exports, and SSO logs), give your engineering leadership access to the dashboards, and walk you through what we find. In exchange, we get permission to learn from anonymised, aggregate signal in your data as we harden the product. There is no licence fee. Our time is paid in line with our other advisory work, scoped to a fixed window so it stays predictable.
Who Atlas is built for
Atlas is most useful when several of these are true:
Your engineering organisation is past the AI pilot stage. At least a few dozen engineers are using sanctioned AI tools and the data is thick enough to mean something.
AI spend is now large enough that the next budget conversation will be about ROI, not pilot enthusiasm.
You sell into enterprises or operate in a regulated industry, so "show us what AI did in your codebase" is a real conversation, not a hypothetical.
Your team uses two or more AI tools or providers, and the comparison between them is no longer obvious from any single dashboard.
You have at least one significant model, vendor, or pricing decision landing in the next quarter, and you want the call to be a quantitative one.
It is probably not the right fit when:
You are still piloting AI with a small group, and the data is too thin to support real conclusions. We would point you to the AI adoption checklist first.
All of your AI usage runs through one vendor's IDE and you trust their dashboard for the questions you have today.
You already operate a mature internal AI platform team with its own observability stack. We may be useful for one-off benchmarking, but not as your operating layer.
Your priority is enforcement, not measurement. Atlas tells you what is happening; it does not block what is happening.
If that profile fits and you would like to talk about a design-partner slot, get in touch. We will walk you through what Atlas surfaces today, what is still being built, and the shape of the arrangement. No procurement loop, no licence to negotiate.